Top 10 HR KPIs
Are you measuring the right HR KPIs? From hiring to retention: Discover the key metrics that drive success.
First, some basics: KPI stands for Key Performance Indicator and is a measurable value. KPIs help organisations to track progress towards strategic goals. Companies use KPIs like year-over-year sales growth, employee retention rates, or customer satisfaction scores. Such indicators assist decision-makers in determining if they're on the right track or need to adjust their strategies. The KPIs of HR should align closely with an organisation's overall goals.
Crawl before you walk
Achieving success with data-driven HR requires a structured approach. Think of it as progressing through three key milestones:
- Start with HR data
Establish a solid foundation. Collect, organise and ensure the quality of HR data. - Culture of informed decisions
Leverage data analytics to identify trends, measure key HR metrics, and support evidence-based decision-making. - Implement targeted initiatives
HR data should be used not only to explain what has happened but also to shape strategic decisions and drive continuous improvement in the organisation. Use insights from HR data to develop and execute strategic initiatives.
Time-to-hire
Measuring recruitment duration enhances candidate experience and reduces the business impact caused by vacant roles. A broad definition of the process is to measure time spent all the way from budget approval or resignation of the predecessor, until start date of the new employee.
Some companies measure the time between milestones along the way, such as the dates the job ad was posted, the application was received, and the offer was accepted.
Time-to-hire = First day – Start of recruitment
Within recruitment another important KPI worth mentioning is cost per hire. It helps organizations control recruitment costs without compromising the quality of new hires. It's a balance between investing in finding the right talent and maintaining budgetary constraints.
New Hire Turnover
Selecting the right candidates and ensuring a smooth onboarding experience are critical to retaining new employees. A high turnover rate among new hires can signal issues in the recruitment process, cultural fit, role expectations, or onboarding effectiveness.
Number of employees leaving within the first year / Total new hires in the same period) × 100
Training Hours
Training hours offer insight into the organization's investment in employee growth and professional development. This metric helps evaluate the effectiveness and scale of training relative to workforce size.
How to measure:
Total hours spent on training and development programs / Total number of employees
Comparing training hours per employee with other organisations is beneficial. Internally, analysing training hours by gender, age, department, and job level can enrich strategic decisions.
To compare the KPI with other companies, look at training hours per employee. For internal benchmarking and strategy adjustments, it is interesting to look at gender, age, departments and differences between leaders and employees.
👉 Traditionally, training cost has been a quick way to analyse training. More and more training and development happens on the job, through free webinars, course providers or academia. That makes time a more neutral factor.
Headcount
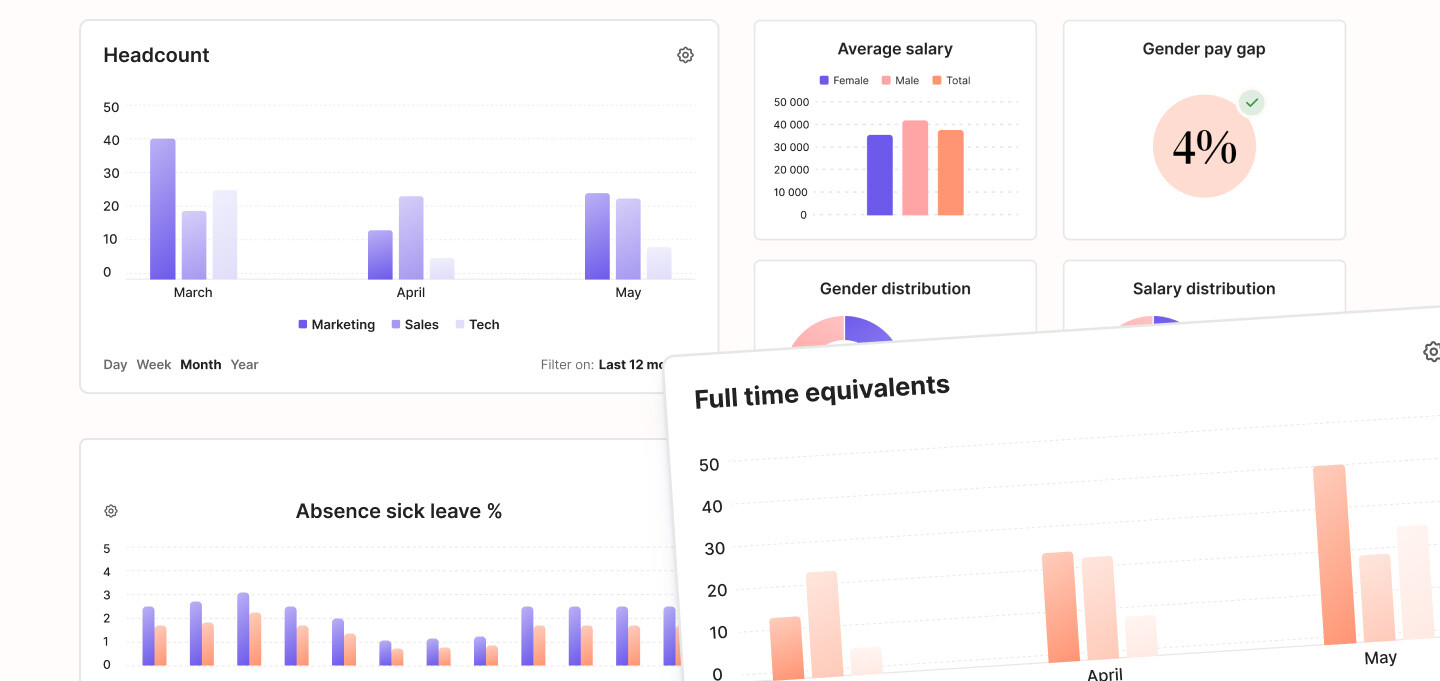
To keep track of the headcount of the company is an important metric. Accurate headcount data is vital for analyzing internal mobility and turnover, and to drill down into other interesting KPIs like employees per gender, managers per employee and revenue per employee.
Total number of active employees at a specific point in time
Many companies keep track of both active employees and Full Time Equivalents. The latter means that two employees in 50% positions count as 1 FTE. For deeper insights, headcount can be analysed by contract type or department.
👉 To get the headcount right, it is important to define who to include or exclude, such as employees on extended unpaid leaves, not yet started, in their notice period, consultants and freelancers.

Gender Pay Gap
Many organizations measure Diversity, Equity, Inclusion, and Belonging (DEIB) KPIs, promoting fairness and representation within the workforce. Gender Pay Gap Percentage is probably the most important KPI in this area.
The pay transparency laws require companies in various countries to report on gender pay disparities. To conduct a correct pay gap analysis, it is important to evaluate pay disparities between employees with similar work. Correct grouping of the staff is an important part of the analysis.
(Average salary of men − Average salary of women) / Average salary of men × 100
Other KPIs in the same category is inclusion surveys (to gather feedback on employee experiences) and gender equality in leave patterns, such as sick child leave and parental leave.
Please fill out the form below to access the full article.
Remote Work
Many companies have a policy on remote working. Measuring satisfaction with work-from-home (WFH) policies can provide valuable insights into team preferences and office usage. Teams might have decided office only, mainly office, mainly from home or fully remote. Based on policy and desk availability, teams could have employees with a desire both to increase and reduce the office attendance set in the team contract or site regulations.
Employee satisfaction with current remote work policy (more office, satisfied, less office, fully remote)
Tracking office attendance is a key HR KPI in many industries to understand workplace utilization and employee engagement. Measuring attendance provides insight into how employees balance remote and in-office work, as well as the effectiveness of workplace policies.
eNPS
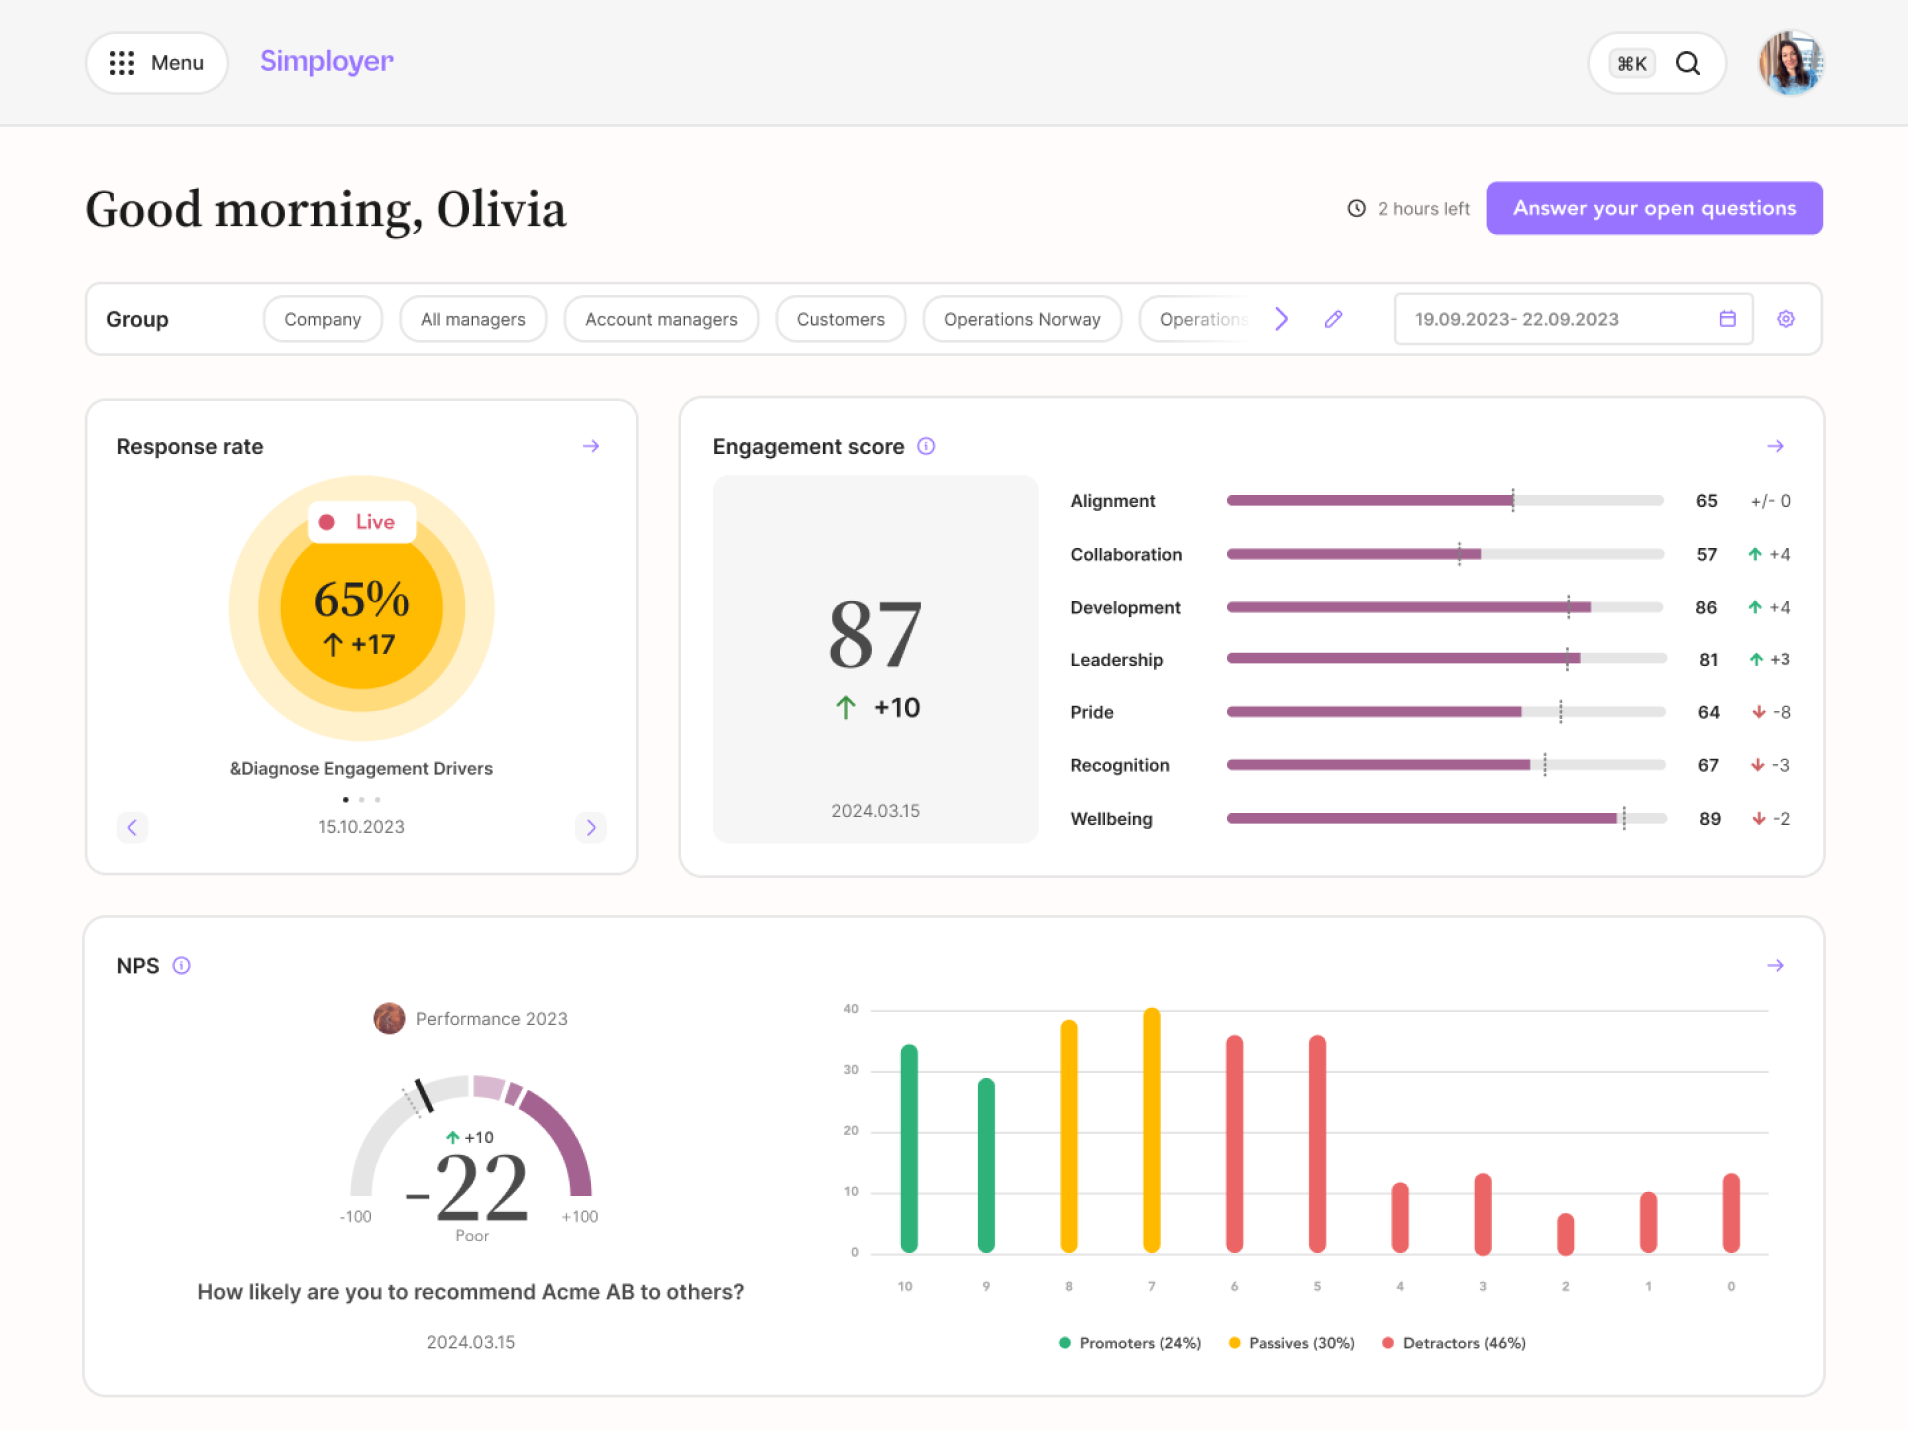
Determine the eNPS by asking employees how likely they are to recommend the organization as a place to work on a scale (typically from 0 to 10). Categorize the responses into promoters (9-10), passives (7-8), and detractors (0-6). Subtract detractors from promoters to get the eNPS score.
Percentage of promoters (scores 9–10) − Percentage of detractors (scores 0–6)
Engaged employees are generally more motivated, productive, and loyal. Measuring employee engagement and following it as a KPI offers valuable insights into employees' overall attitude towards the organization, their wellbeing, and satisfaction. Conduct regular surveys on topics like work-life balance, recognition, leadership, alignment, career development, and company culture. Identifying engagement drivers helps target strategies to enhance employee satisfaction. For example a driver could be pride, meaning the self-esteem an employee feel being associated with the company.

Sick Leave
High rates in these areas can indicate issues like poor job fit, workplace stress, or leadership problems. Understanding these metrics is essential for improving employee well-being and job satisfaction.
(Total days of employee absence / Total workdays) × 100
An interesting aspect to monitor is the pattern of sick leaves by day of the week. This can reveal trends such as a higher frequency of sick leaves on certain days, which might indicate underlying issues in work-life balance or workplace satisfaction. To look at average duration and types of illness is other metrics that would make it easier to conduct the right interventions to improve employee health and workplace satisfaction. In some companies the challenge is a high number of short sick leaves, while many companies have the majority of their sick leave days concentrated on sick leaves with a duration of many weeks and months.
.png?width=1386&height=1038&name=HRM-Features-Analytics-CustomDashboard%20(2).png)
Employee turnover rate
A high voluntary turnover rate often signals underlying issues in the workplace such as poor job satisfaction or ineffective management. Understanding and addressing these issues is vital to improve employee retention, reduce hiring costs, and maintain a stable, experienced workforce. The broadest measure of turnover includes all departures in a period. It can give a general sense of workforce stability.
(Number of employees who left / Average number of employees) x 100
Resignations are among reasons for departure, while company decisions like layoffs and terminations is another group of turnover.
An important part of measuring employee turnover rate is to connect it to business strategy. If the company has a strategy of natural attrition (not replacing people that quit), it is relevant to measure which exits that trigger a recruitment.
👉 Benchmark values for employee turnover vary with macroeconomic conditions and geographical markets, as well as industries and average age of employees.
Exit Interview Data
Encourage employees to complete exit interviews, either via structured surveys or face-to-face discussions. Understanding why employees leave is essential for improving retention, company culture, and overall employee satisfaction. Exit interview data provides insights into trends in voluntary turnover, workplace issues, and areas for improvement.
(Number of exits categorized under a specific reason / Total number of exit interviews) × 100
Clear and consistent categorization of exit reasons allows organisations to identify trends and address areas for improvement. Exit reasons might be very specific like “shorter commute”, “offer from competitor”, “career switch” or “start own business”. More culture-oriented categories can be “conflicts with colleagues”, “dissatisfaction with manager” and “poor work-life balance”.
Use a mix of qualitative and quantitative data in exit analysis. Open-ended feedback can give deeper insights.
Predictive KPIs
The 10 KPIs mentioned in this article are traditional HR KPIs, looking at the current and past situation in the company. HR today holds a goldmine of data, but all too often, it is only used for historical reporting. To become a truly strategic HR function, use data to anticipate trends, identify challenges, and make proactive decisions. Time-to-fill and future employee productivity are good examples of areas where forecasting can improve budgeting. In predictive analytics AI is a great companion!
Wrapping it up
The Top 10 KPIs are insights into the core of your organization. By tracking these, you will boost both efficiency and your team's growth. Remember, behind every metric is a team member making it all happen. Here’s to an insightful and people-focused 2025! 💜
